Home
The screen every session starts on, showing what needs attention and what is in your data right now.
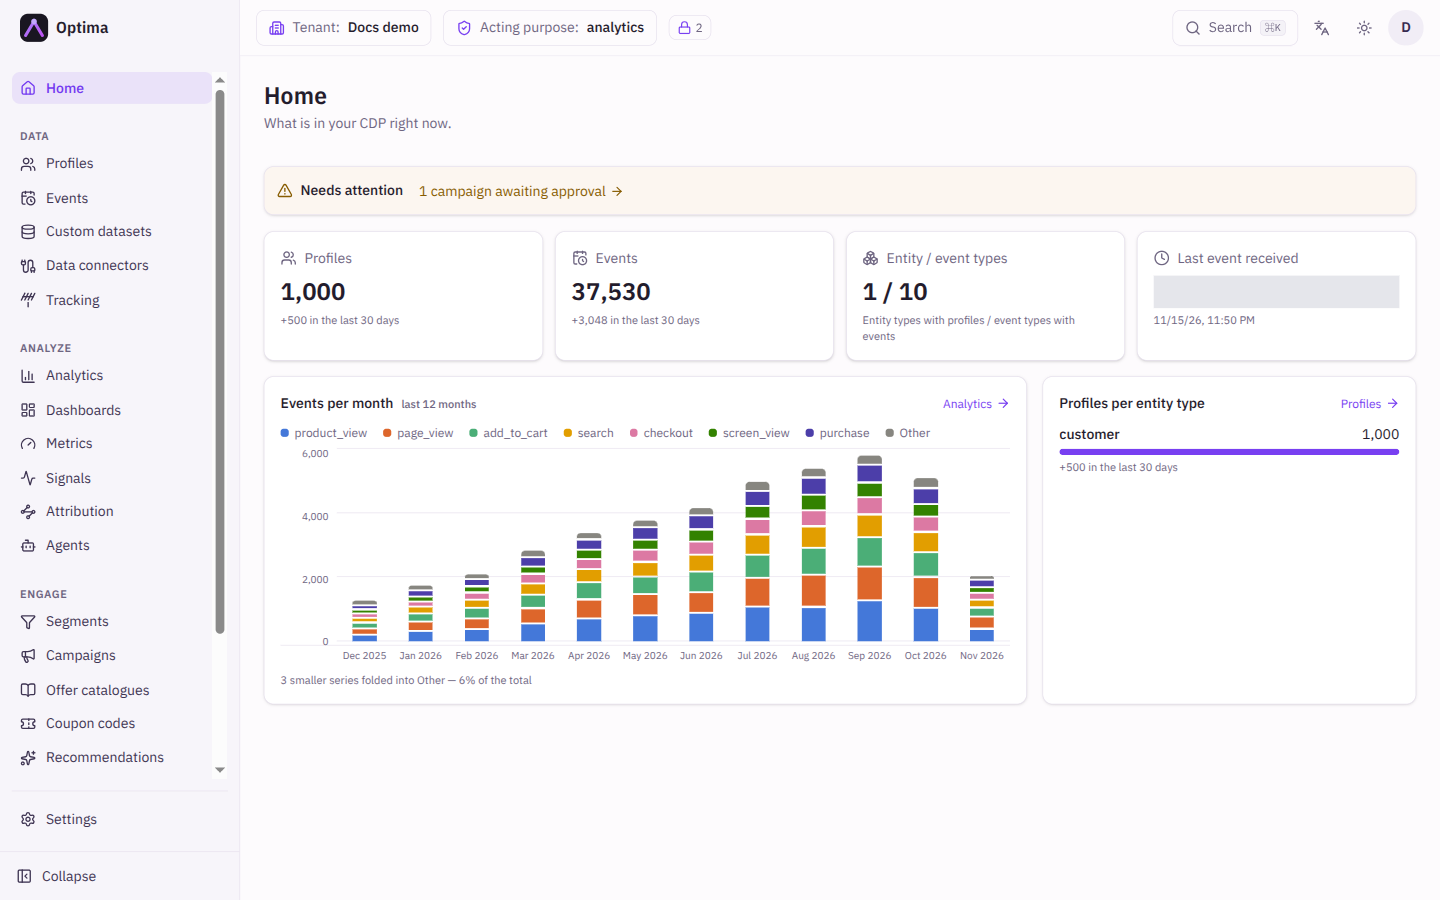
Home is where the console opens. It answers two questions at a glance: what needs someone today, and how much data Optima holds right now. Every line on it is a link into the screen that handles the item, so it works as a to-do list as well as a summary.
Who uses it
Everyone who signs in can open Home. The Needs attention strip only lists items from areas your roles can open: a campaign approver sees approvals, a privacy officer sees erasure requests, and so on. A reader without access to an area simply sees no line for it.
The overview below the strip (counts, chart and entity shares) needs a role that can read the analytics overview, such as analytics_viewer (see Licences and roles). Without one, the overview is not requested and a Welcome to Optima card lists the areas your roles can open instead, so a new user does not land on an error. The strip works either way.
What the screen shows
Needs attention
A strip at the top. When nothing is waiting it says Nothing needs your attention right now. Otherwise it lists one line per kind of item, each a link:
| Line | Meaning | Opens |
|---|---|---|
| Campaigns awaiting approval | Campaigns submitted and not yet approved | Campaign approvals |
| Assets awaiting approval | Content submitted and not yet approved | Content approvals |
| Metric alerts in the last 7 days | Metrics that fired an alert during the past week | Metric alerts |
| Metrics failing to compute | Metrics whose last check produced an error, so the value shown is stale | Metrics |
| Erasure requests pending | Erasure requests that have not completed | Privacy, Erasure tab |
| Failed connector runs in 24h across N connectors | Data connector runs that failed in the past day, with how many connectors they came from | Data connectors, run log filtered to failures |
| Profiles, Today's events or Connectors at N% of quota | A usage allowance is close to its limit (80 percent or more) | Usage |
The connector line gives both numbers on purpose. One connector failing seven times usually means a broken credential; seven connectors failing once each points to an outage.
Overview
Below the strip, the default view shows:
- Profiles: total profiles, and how many were added in the last 30 days.
- Events: total events, and how many arrived in the last 30 days.
- Entity / event types: how many entity types have profiles, and how many event types have events. Select it to open the schema.
- Last event received: how long ago the most recent event arrived, with its date. If no events have arrived it says No events ingested yet.
- Events per month: a stacked column chart by Event type for the last 12 months. The Analytics link opens the analytics screens.
- Profiles per entity type: each entity type with its count, its share of all profiles and its growth over the last 30 days. The Profiles link opens the profile list.
On an empty environment a Getting started card appears with four first steps: Define entities and event types, Connect a data source, Set up web/app tracking and Build a dashboard.
Your home dashboard
If you mark a dashboard as your home dashboard (Set as home on the Dashboards screen), Home shows that dashboard instead of the overview. The Needs attention strip stays on top. Two buttons appear in the header: one with the dashboard's name and Overview switch between the two views, and Open dashboard opens the dashboard on the Dashboards screen. A role that cannot read the overview gets no switch, only Open dashboard. Remove as home on the Dashboards screen restores the overview.
Fields
Home has no input fields. The settings it reacts to:
| Field | Meaning | Valid values | Default |
|---|---|---|---|
| Home dashboard | The dashboard shown instead of the overview. Set per user with Set as home on the Dashboards screen. | Any dashboard you can open | None, so the overview shows |
Actions
- Select a line in Needs attention: opens the screen that handles it. Nothing changes on Home itself.
- Select a count tile or a heading link: opens Profiles, Events, the schema, Analytics or Profiles.
- Overview / dashboard toggle: switches between your home dashboard and the built-in overview. It remembers nothing; the next visit shows the home dashboard again. Not shown when your role cannot read the overview.
- Open dashboard: opens the home dashboard on the Dashboards screen.
Examples
Start of day as a campaign manager. Open Home. The strip reads "2 campaigns awaiting approval". Select it, review the two campaigns, and come back. Once both are decided the line disappears.
Business owner who wants numbers first. On the Dashboards screen, build a dashboard with your revenue and campaign charts and choose Set as home. Home now opens on it.
Common problems
-
"Could not load the overview." The overview request failed. A role without access to the overview figures sees the Welcome to Optima card instead; ask an administrator for
analytics_viewerif you need them. The Needs attention strip and your home dashboard are not affected. -
The strip says nothing needs attention, but I expected an approval. The strip shows only areas your roles can open. If you cannot open campaign approvals, the line never appears for you.
-
A connector line shows failures, but the connector looks fine. The count covers the past 24 hours. Open the run log to see which runs failed and why.
-
The counts look lower than expected. Counts reflect what has been processed. Data that was just sent can take a short while to appear.
-
Home shows my dashboard but I want the overview. Select Overview in the header, or Remove as home on the Dashboards screen.