Dashboards
Compose saved reports, metrics and notes into pages on a 12-column grid, and choose one as the page Home opens on.
A dashboard is a page of tiles. Each tile shows a saved report, a metric or a note you write yourself. Build one dashboard per audience, for example "Weekly revenue" for management or "Campaign health" for the campaign team, and the people who open it always see the latest figures without rebuilding anything.
Who uses it
Business owners and anyone who reviews results regularly. Opening dashboards with metric and text tiles needs analytics_viewer. Report tiles run their report when the dashboard opens, which also works with analytics_viewer. Creating and deleting dashboards, adding, editing and removing tiles and arranging the layout need analytics_editor. You can also use another role your administrator has given access to this area — see Licences and roles. Setting a home dashboard is personal and needs no editing role.
Fields
The dashboard list
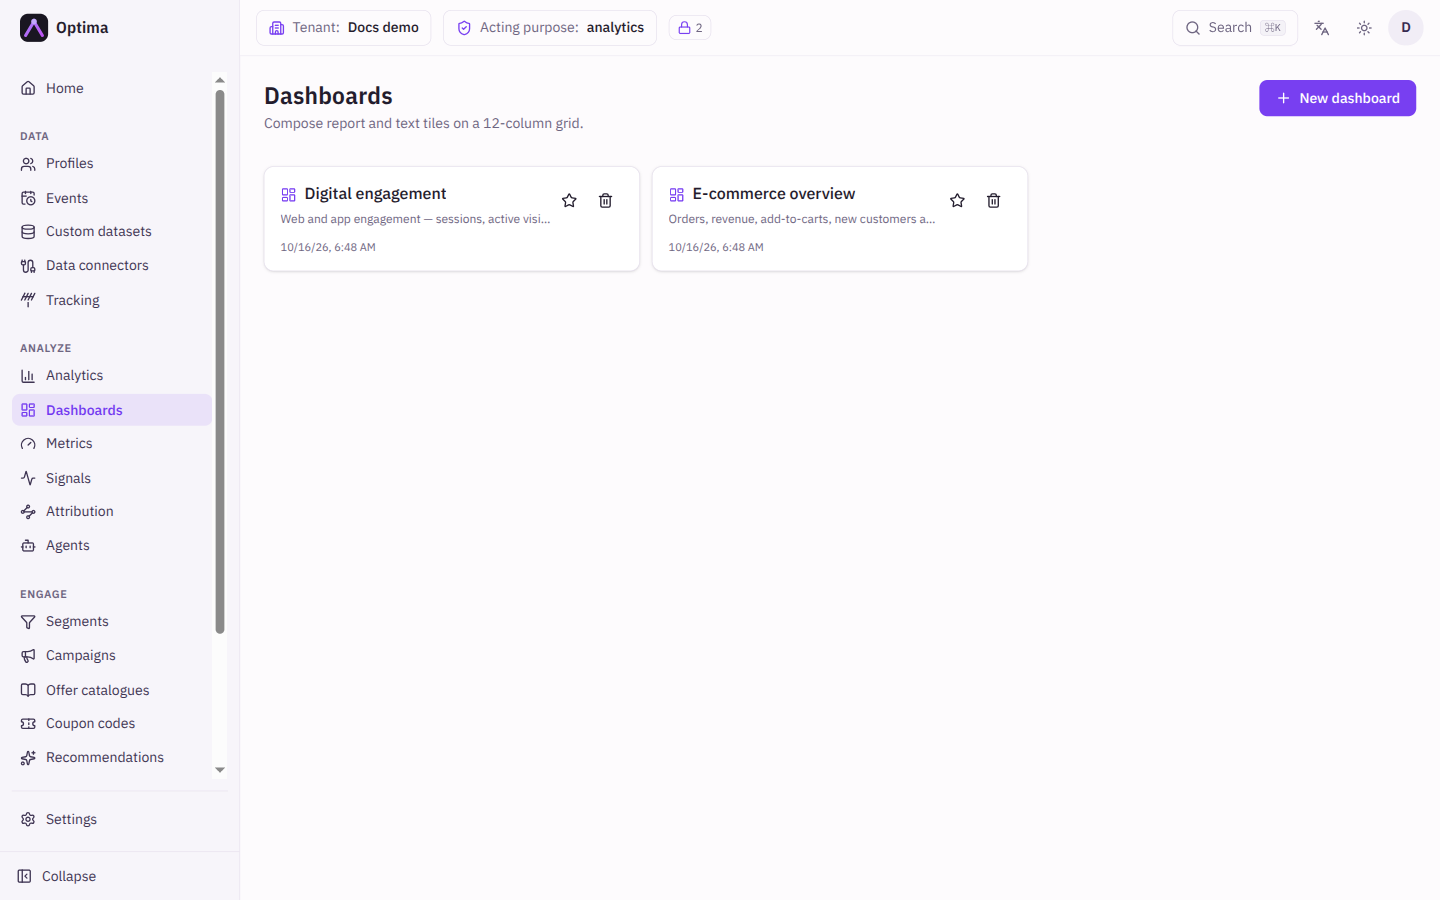
Each card shows the dashboard name, its description and when it was last updated. A Home badge marks your home dashboard.
New dashboard opens a dialog.
| Field | Meaning | Valid values | Default |
|---|---|---|---|
| Dashboard name | The name on the card and page header. | Text, required | Empty |
| Description | One line shown under the name. | Text | Empty |
A tile
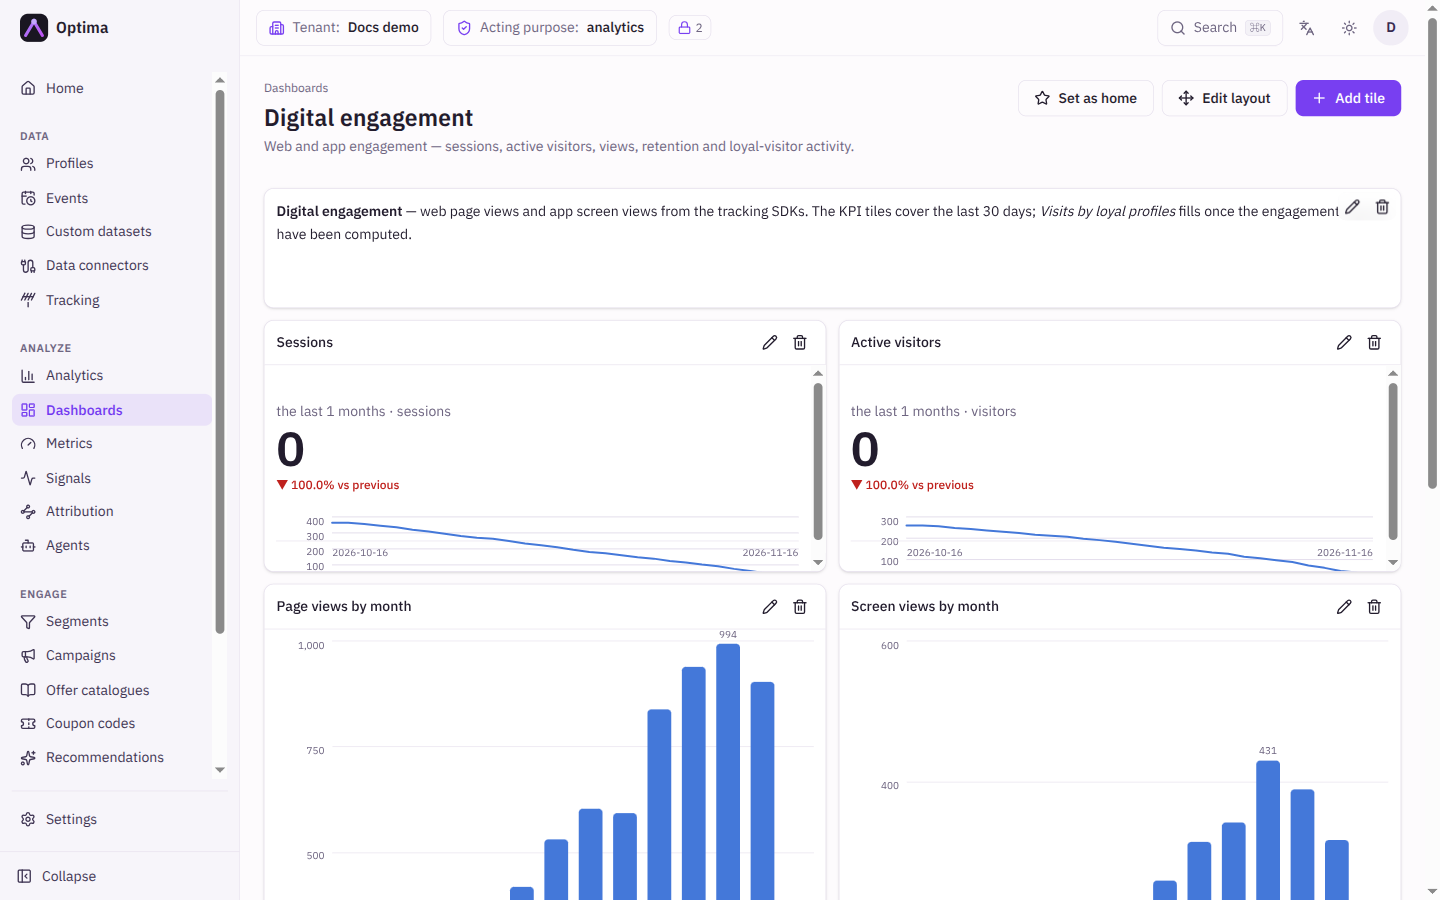
A report tile that your role cannot run says so on the tile ("Your role cannot run this report.") instead of staying blank. A chart that cannot be drawn from its result, for example a scatter plot without two numeric columns, says what is missing.
Add tile on a dashboard offers three kinds.
| Field | Applies to | Meaning | Valid values | Default |
|---|---|---|---|---|
| Tile title | All | The heading on the tile. A report or metric tile uses the report or metric name when empty. A text tile has no title bar: write its heading in the content. | Text | Empty |
| Report | Report tile | The saved report to draw. The chart type comes from the report: change it on the Analytics screen and save the report. | Select a report, then any saved report | None |
| Show the data table too | Report tile | Adds the result table under the chart. | On or off | Off |
| Metric | Metric tile | The metric to show. If none exist yet, create one under Analyze, then Metrics. | Select a metric..., then any metric | None |
| Show | Metric tile | What the tile displays. | The number, The history, Number and history | The number |
| Content (Markdown) | Text tile | Your note. Markdown supports headings, bold, italic, code, lists, quotes, tables and links. HTML is shown as plain text. | Markdown text | Empty |
A metric tile shows the last value that was recorded. It does not recompute the metric, so opening a dashboard never starts a fresh query. If the metric was deleted, the tile says so; remove the tile or point it at another metric.
Actions
- Open a dashboard by selecting its card.
- Set as home (star on the card, or the button on the dashboard) makes Home show this dashboard for you instead of the overview. Remove as home undoes it. See Home.
- Add tile, then Report tile, Metric tile or Text tile.
- Edit layout switches to arranging mode: drag a tile to move it, or drag its right or bottom edge to resize it. The grid is 12 columns wide, so a tile is between 1 and 12 columns wide and cannot extend past the right edge. Tiles below make room automatically. Save layout keeps the arrangement; Cancel discards it. The layout editor is not offered on narrow screens, where tiles stack in one column.
- The pencil on a tile edits it. The bin removes it without asking, and a message with Undo appears so you can put the tile back where it was.
- The bin on a dashboard card deletes the whole dashboard after a confirmation.
Examples
Management view. Create "Weekly revenue". Add a report tile for the weekly purchases report, a metric tile for "Purchases (7 days)" showing Number and history, and a text tile with a heading and a sentence about how the figures are defined. Choose Set as home so Home opens on it.
Campaign health. Add metric tiles showing The number for delivery volume and a report tile with Show the data table too for the per-campaign breakdown.
Common problems
- The report picker is empty. No report has been saved yet. Build one in Analytics and choose Save as report.
- A report tile shows only a dot. The report could not be run for you, because it is built from data your privacy clearance does not cover (purpose or PII level). Ask a privacy officer or administrator; the other tiles still work.
- A tile asks me to choose a report. The tile has no report selected. Edit the tile and select one.
- The chart on a tile is the wrong type. The tile draws the report's own chart type. Open the report in Analytics, change the chart type and use Update report.
- A metric tile is out of date. It shows the last recorded value. Open the metric and use Trigger to record a fresh value, or wait for its next scheduled check.
- The buttons for changing a dashboard are disabled. Your role can view but not change dashboards. Ask for
analytics_editor. - Edit layout is missing. The window is narrow. Widen it or use a larger screen.