Analytics
Build aggregate, funnel and retention queries on the workbench, chart the result, and save the question as a reusable report.
Analytics is where you ask a question of your data. You choose what to look at (profiles, one type of event, or a custom dataset), what to measure, how to break it down and which time range to cover, then run the query and read the result as a chart or a table. A question you will ask again can be saved as a report, which you can re-run later and put on a dashboard.
Who uses it
Business owners and campaign managers who want an answer without asking someone to export data. Running ad-hoc queries, reading saved reports and running them from the Saved reports tab need analytics_viewer. Saving, updating and deleting reports need analytics_editor. You can also use another role your administrator has given access to this area — see Licences and roles.
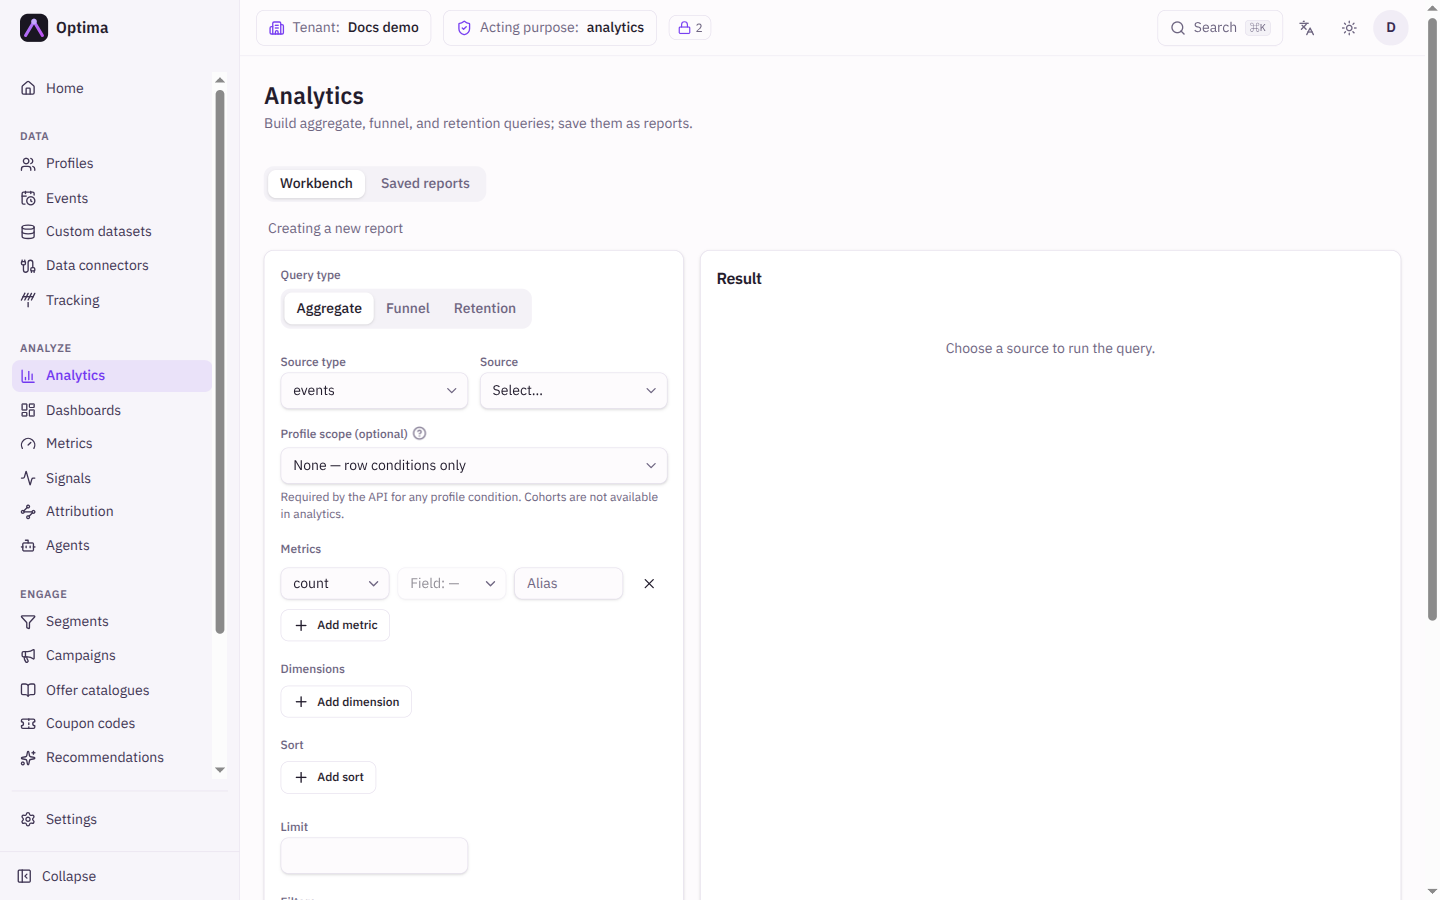
The screen has two tabs: Workbench and Saved reports.
Fields
Query type
Choose one with the switch at the top of the form.
| Query type | Answers | Example |
|---|---|---|
| Aggregate | How many, how much, how often, optionally broken down by a field or by time. | Purchases per week, revenue per country. |
| Funnel | How many profiles get through a sequence of events, step by step. | Viewed product, then added to cart, then purchased. |
| Retention | Of the profiles that did something first, how many come back in later periods. | Of the people who registered, how many logged in again in each following week. |
Source (aggregate)
| Field | Meaning | Valid values | Default |
|---|---|---|---|
| Source type | What the rows are. Changing it clears the filters, because each source has its own fields. | profiles, events, custom dataset | events |
| Source | Which entity type, event type or dataset. | Any entity type, event type or custom dataset you have | Empty (the query cannot run until you choose) |
| Profile scope (optional) | For event and dataset sources only: pick an entity type to also filter by the profile each row belongs to (its attributes, identifiers, events, consents, signals, computed attributes, linked datasets and related profiles). Cohorts are not available in Analytics. | None — row conditions only or an entity type | None |
Metrics, dimensions, sort and limit (aggregate)
| Field | Meaning | Valid values | Default |
|---|---|---|---|
| Metrics | The numbers to compute. Each has a Function, a Field and an optional Alias (the column name in the result). Use Add metric for more. | Functions count, count_distinct, sum, avg, min, max. sum and avg offer only numeric fields. count needs no field. | One count |
| Dimensions | Fields to break the numbers down by. A date field can also take a Granularity. Use Add dimension for more. | Any field of the source. Granularity day, week, month, year. | None |
| Sort | Order of the result rows, picked from the query's own columns, each ascending or descending. | Metrics and dimensions you have already added | Unsorted |
| Limit | Maximum number of rows returned. | A whole number | Empty |
Funnel
| Field | Meaning | Valid values | Default |
|---|---|---|---|
| Entity type | The kind of profile that moves through the funnel. | Any entity type | Empty |
| Funnel steps | The events, in order. Each step has an event type and a Label, and can carry its own filter. An event that fails the step filter does not advance the profile, so the profile stops at the previous step. Add step adds one. | Event types in your schema | Empty |
| Conversion window (days) | How long a profile has to complete the steps. | A whole number | 7 |
Retention
| Field | Meaning | Valid values | Default |
|---|---|---|---|
| Entity type | The kind of profile whose retention you measure. | Any entity type | Empty |
| Cohort event | The event that puts a profile into a cohort, for example registration. | Event types | Empty |
| Activity event | The event that counts as coming back. | Event types | Empty |
| Granularity | The length of one period. | day, week, month | week |
| Periods | How many periods to follow each cohort. | A whole number | 8 |
For retention, the filter selects who enters a cohort; returning activity is not filtered.
Filters, time range and time zone
| Field | Meaning | Valid values | Default |
|---|---|---|---|
| Filters | Conditions on the rows. For profile queries these are conditions on the profiles' attributes and identifiers; for events and datasets they are conditions on each row's own columns and attributes (and on its profile, if you set a profile scope). See query filters. | Rules and groups from the filter builder | None |
| From / To | The date range to cover. | Dates | Empty (all time) |
| Time zone | Which calendar daily, weekly and monthly buckets follow. By default each viewer sees the report on their own calendar. Pin a time zone makes everyone see the same buckets; Use each viewer's zone removes the pin. | Any time zone | Each viewer's own |
Saving a report
Save as report opens a dialog.
| Field | Meaning | Valid values | Default |
|---|---|---|---|
| Report name | The name in the Saved reports list. | Text, required | Empty |
| Description | What the report answers. | Text | Empty |
| Folder | Groups reports. Use / to nest folders, for example Campaign reports/2026/Autumn. | Text | None |
| Tags | Labels you can filter by. | Text | None |
Saving is refused (403) when the query reads data your privacy clearance or granted purposes do not cover: a saved report can run later for someone else or on a schedule, so you can only save what you could run yourself.
Actions
-
Run query computes the result. The line above the chart shows how many rows came back, how long it took, and whether the answer came from a recent cached run.
-
Chart type (shown once there is a result) changes how the result is drawn. The choices depend on the query type.
Query type Chart types Aggregate Column chart, Bar chart (horizontal), Line chart, Area chart, Pie chart, Donut chart, Single number, Heatmap, Scatter plot, Table Funnel Funnel, Bar chart, Column chart, Table Retention Heatmap, Line chart, Table Depending on the chart, options such as Category, Break down by, Values, Stacked, Show values, Max categories and Max slices appear. Long tails are folded into an Other slice and the chart says how many series were folded. The chart type is saved with the report.
-
Save as report saves the query and the chart. When you opened an existing report, the button reads Update report, and the dialog also offers Save as copy.
-
New report (in the banner above the form while you are editing a report) returns the workbench to a blank query.
-
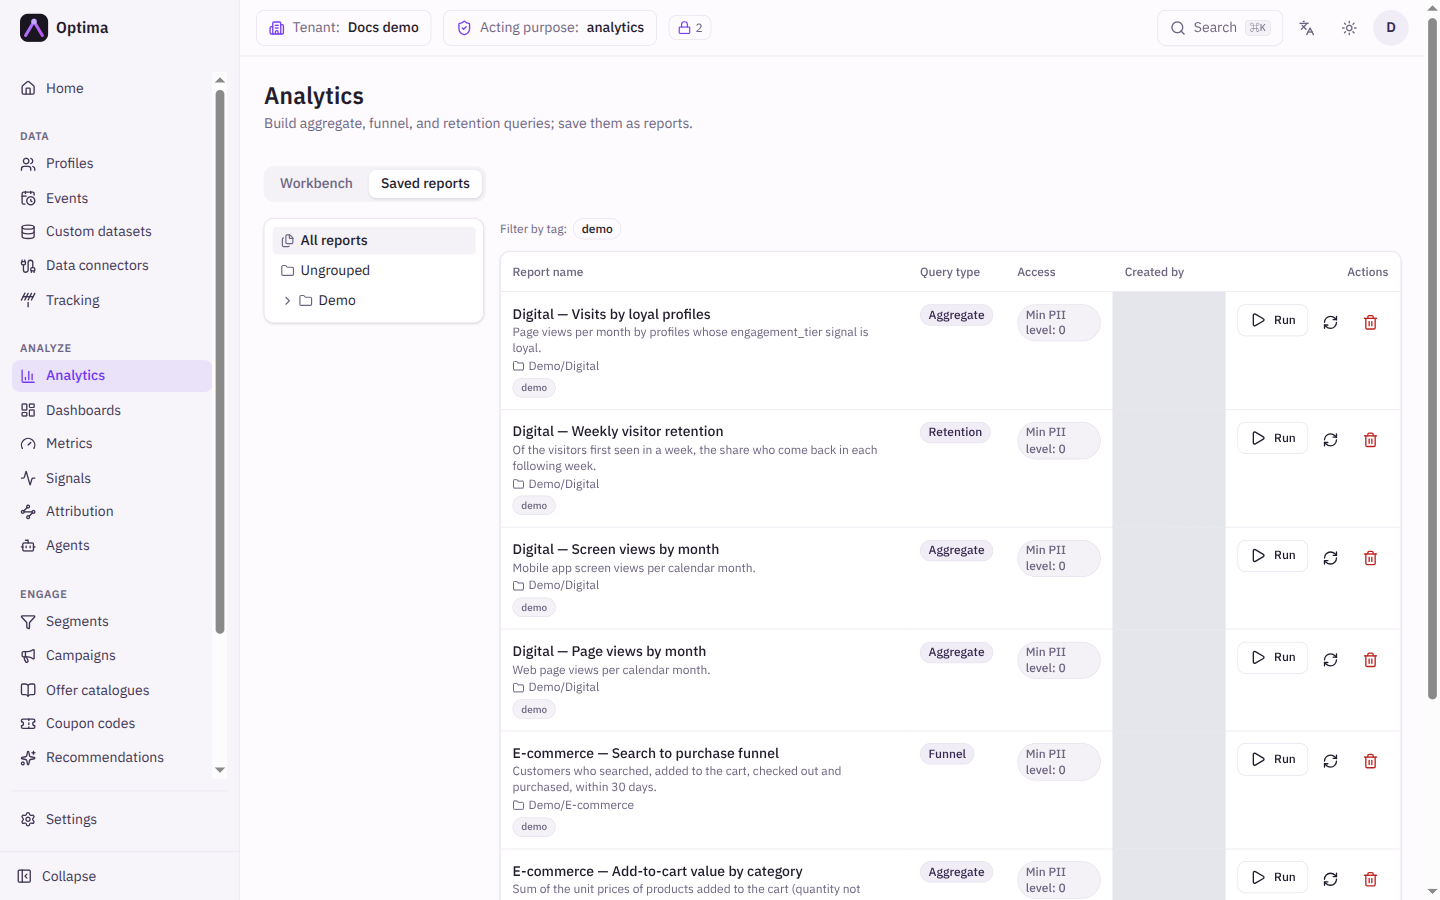
Saved reports tab (below) lists reports with their Name, Query type, Access (the minimum privacy level and the purposes a reader needs, see below), Created by and Actions. Select a name to open the report in the workbench; if the workbench already holds work, Optima asks you to confirm Open and replace. Run draws the report in place below the list. The refresh button (Run fresh) skips the cached result and recomputes now. The bin deletes the report.
-
The folder list on the left and the tag chips above the table filter reports. All reports clears the folder filter.
Saved reports tab
Examples
Weekly purchases. Aggregate, source type events, source purchase, metric count, dimension: the event's date with granularity week, From the first day of the quarter. Chart type Column chart.
Revenue by country. Aggregate, source type events, source purchase, metric sum on the order value field, dimension: country, sort descending by the sum, limit 10. Chart type Bar chart (horizontal).
Checkout funnel. Funnel, entity type your customer type, steps product_view, add_to_cart, purchase, conversion window 7 days. Chart type Funnel.
Weekly retention of new customers. Retention, cohort event registration, activity event login, granularity week, periods 8. Chart type Heatmap.
Common problems
- "Choose a source to run the query." The source field is empty. Pick the entity type, event type or dataset first.
- The sort list is empty. Sort picks from the query's own columns. Add a metric or dimension first.
- A field I expected is missing from a metric.
sumandavgonly offer numeric fields;countneeds no field. - A report will not run for me. The report is built from data your privacy clearance does not cover (the Access column shows the minimum PII level and purposes it requires; ask a privacy officer or administrator, see consent and purposes).
- Numbers differ between colleagues. The report follows each viewer's time zone. Pin a time zone before saving.
- I cannot save. Saving needs
analytics_editor; the buttons that change data are disabled for read-only roles.
Related
- Dashboards, where saved reports become tiles
- Metrics, for a single number watched on a schedule
- Query filters
- Events to look at the raw events behind a report
- Home