Usage
See what your environment and account are metered at, against the band your contract allows.
The Usage screen shows how much of Optima you are using and how that compares with what you contracted. Nothing on it blocks anything: "going over a band brings a warning, an alert email and, if it persists, an invoice line." Ingest, decisioning and sending carry on whatever the band. Open it under Settings → Workspace → Usage.
Who uses it
Business owners and tenant administrators who watch consumption, and auditors. The screen is part of the core licence. It is readable with the admin role, or team_manager, integration_viewer or auditor, or another role your administrator has given access to this area — see Licences and roles. The Account tab is shown only to admin, account_admin, instance_admin and auditor who are members of the account, and an Instance tab, the instance-wide fleet ranking, appears only for instance administrators.
Fields
This tenant
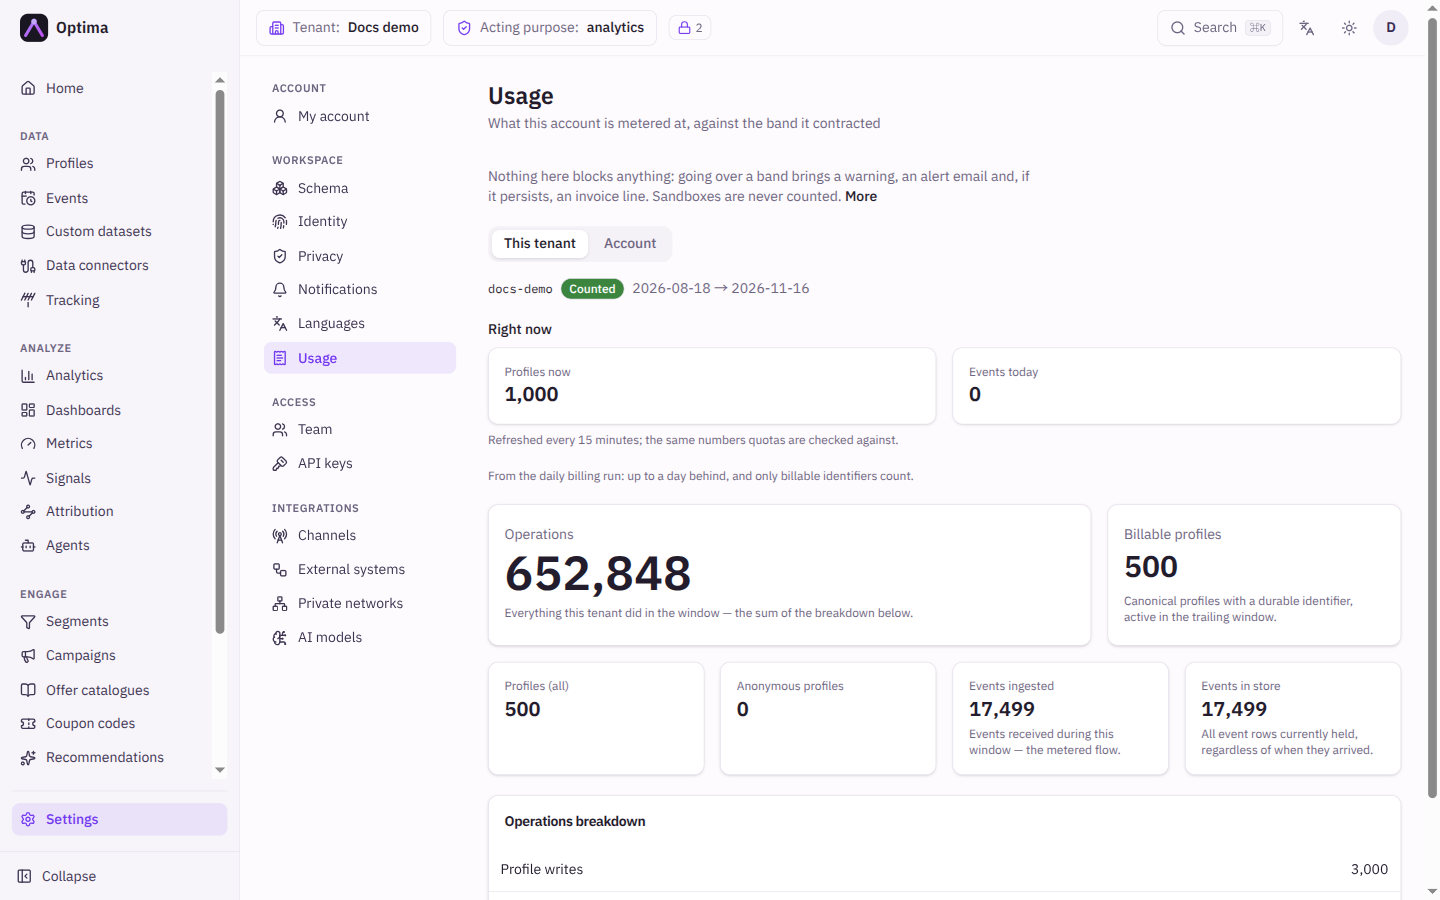
This tab shows what the current environment contributed over a rolling window, with its dates. A badge says whether it is Counted or Not counted: "Sandbox and development environments never count towards the account's usage", but they are always shown. No band is shown here on purpose, because the licence is contracted for the account.
| Figure | Meaning |
|---|---|
| Operations | Everything the environment did in the window: the sum of the breakdown below. |
| Billable profiles | Canonical profiles with a durable identifier, active in the trailing window. |
| Profiles (all) and Anonymous profiles | Every profile, and those without a durable identifier. |
| Events ingested | Events received during the window, the metered flow. |
| Events in store | All events currently held, whenever they arrived. |
Above the figures, a Right now strip shows the live profile and events-today counts that quotas are checked against, refreshed every 15 minutes. The figures below it come from the daily billing run, so they can be up to a day behind and count only billable identifiers; the two will not match exactly. An older backend that does not report live counts hides the strip.
The Operations breakdown lists Profile writes, NBA decides, Sent communications, Outbound webhooks, Connector rows and Signal computations, so every metered number can be reproduced.
Account
The Account tab compares usage with the contracted band for the current billing period. Its header shows the period dates, whether billing is monthly or annual, the band and "day N of M". Badges can say In ramp — overage suppressed, Averaged across the year, and Peak guard, which means a month exceeded the guard so the annual averaging is waived and that period bills month by month.
- Profiles per customer compares billable profiles with the customers declared on your licence, beside the contracted figure. A value well above it is usually identity resolution creating duplicates rather than real growth, which is worth investigating.
- On an annual contract the band is monthly, so a metric that counts events or operations is compared with the band multiplied by the months measured so far (the card shows a line such as "100 a month × 2 months"), and the projection is judged against the band for the whole period. Billable profiles is a stock and stays on the monthly band. When the peak guard is breached the percentage is labelled Worst month.
- A card per metric (Billable profiles, Events ingested, Operations, Connect events) shows used against the band, a bar, the projection for the whole period, and any amount over band. Unmetered metrics say unmetered.
- The split by environment and the Closed periods table show earlier periods. A period closes on the first scheduled run after its last day, assessed on the complete months of the period: every month counts toward the peak guard, the projection equals the actual usage, and the ramp is judged as of the last day. Periods closed before this behaviour keep the figures they were closed with.
If the account has no stored licence, the tab says so and nothing is metered against a band.
Usage alerts
When the period in progress crosses 80, 100 or 130 percent of a band, Optima emails the account's usage alert subscribers, once per threshold per period. The Account tab lists them. An account administrator adds one by choosing a member of the account; a filter on the threshold, for example only 100, skips the other crossings. Alerts go by email only and do not depend on the account's environments, so they arrive even when an environment is suspended. A subscriber who leaves the account stops receiving them. The platform operator edits the alert's wording for the whole instance.
Actions
Apart from the usage alert subscribers, which account administrators manage, the screen is read-only. Switch tabs to change the view; the selected tab is kept in the address, so you can share a link.
Examples
Check headroom. Open Account, find Billable profiles, and compare the projection with the band. If the projection is above 100 percent, talk to your account manager before the period ends.
Explain an invoice. Open Closed periods to see the figures a past period was assessed on, and whether the peak guard applied.
Common problems
- Percentages on the This tenant tab are missing. By design: the band belongs to the account, so look at the Account tab.
- The Account tab is not shown. Only
admin,account_admin,instance_adminandauditorsee it, and you must be a member of the account. - Profiles per customer reads zero. No customer count is declared on the licence.
- A sandbox shows usage but is not billed. It is marked Not counted.
- No usage alert arrived. Check that you are a usage alert subscriber of the account and that your filter includes the threshold that was crossed.
- You cannot add a usage alert subscriber. Only account administrators can, and the person must be a member of the account.