Alert on a metric
Watch one business number, get an email when it drops or stops, and tune the alert so it stays useful.
This guide sets up a metric that watches daily revenue and emails you when it falls well below the same time last week. The same steps work for any single number: sign-ups, page views, profiles, opened emails.
Before you start
- Creating, previewing and triggering metrics needs the
analytics_editorrole. Reading metrics and the alert feed needsanalytics_viewer. Or use another role your administrator has given access to this area — see Licences and roles. Metrics are part of the core licence, though an agreement can exclude them for an account. - The data you want to watch exists, for example
purchaseevents with an order value attribute. See Events. - Everyone who should receive the alert is a member of this environment. An alert carries a business number, so it can only reach people who could read it by signing in.
Step 1: Create the metric
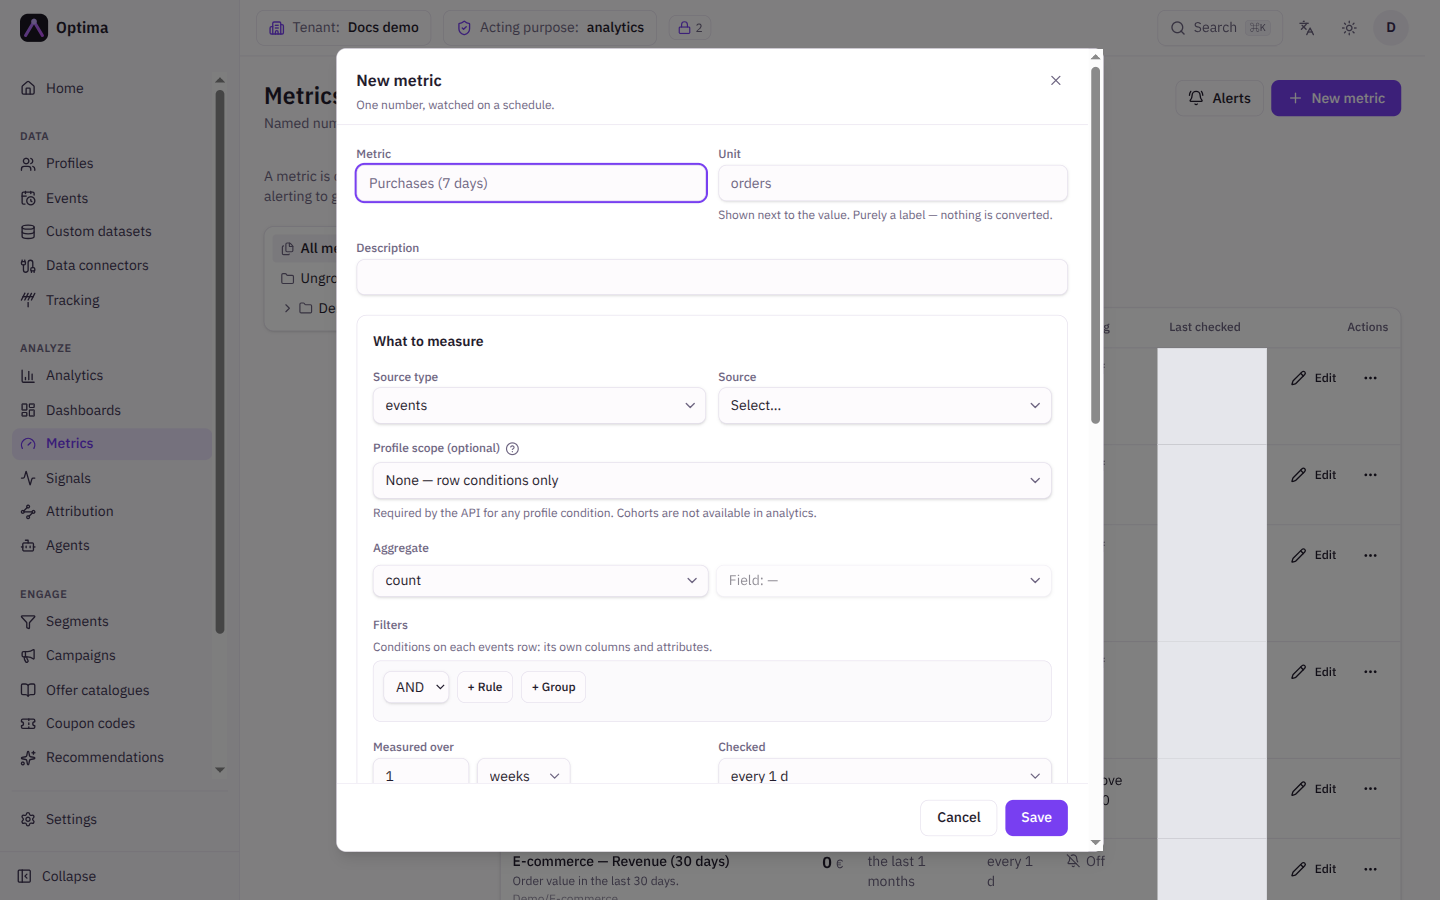
- Open Metrics in the Analyze group and select New metric.
- Enter a Metric name, such as
Daily revenue, a Unit such asEUR, and a Description saying what the number means. The unit is only a label; nothing is converted. - Optionally file it in a Folder such as
Growth/Revenue.
Step 2: Say what to measure
- Set Source type to events and the Source to
purchase. - Choose the Aggregate:
sumof the order value attribute. The functions are the same as in Analytics:count,count_distinct,sum,avg,minandmax. - Add a Filter if only some events count, for example only completed orders.
- Set Measured over to
1days. The window always ends now and rolls forward. Leave the amount empty for all time, which suits totals such as a profile count. - Set Checked to every
1hour. Checking more often than the data moves only adds load. - Select Preview. It computes the value now so you can sanity-check the setup. Nothing is recorded and no alert can fire.
Step 3: Choose the alert
Leave Email me when this changes on, and choose Alert when:
| Goal | Rule | Settings |
|---|---|---|
| Revenue is much lower than usual for this time | It changes against an earlier period | Compare with The same time last week, Alert on Drops only, Change of at least (%) 30 |
| A number must never pass a limit | It crosses a fixed value | Rises above or Falls below, or both |
| A feed went quiet | It stops receiving data | No data for (minutes) 60 |
| Any large movement | It changes by a percentage | Alert on Any change, Change of at least (%) 15 |
Then tune the noise.
- Ignore below is a floor on the metric itself, not on the size of the change. With
50here, a drop from 400 to 0 still alerts but a drop from 20 to 10 does not. Leave it at0to alert on any movement. - Then stay quiet for stops repeats. After an alert no further alert is sent for this long, so a number hovering around the threshold does not email you at every check. The default is 1 day.
- Send to lists who receives the email. If nobody is picked, it goes to whoever created the metric.
Select Save.
Step 4: Test the alert
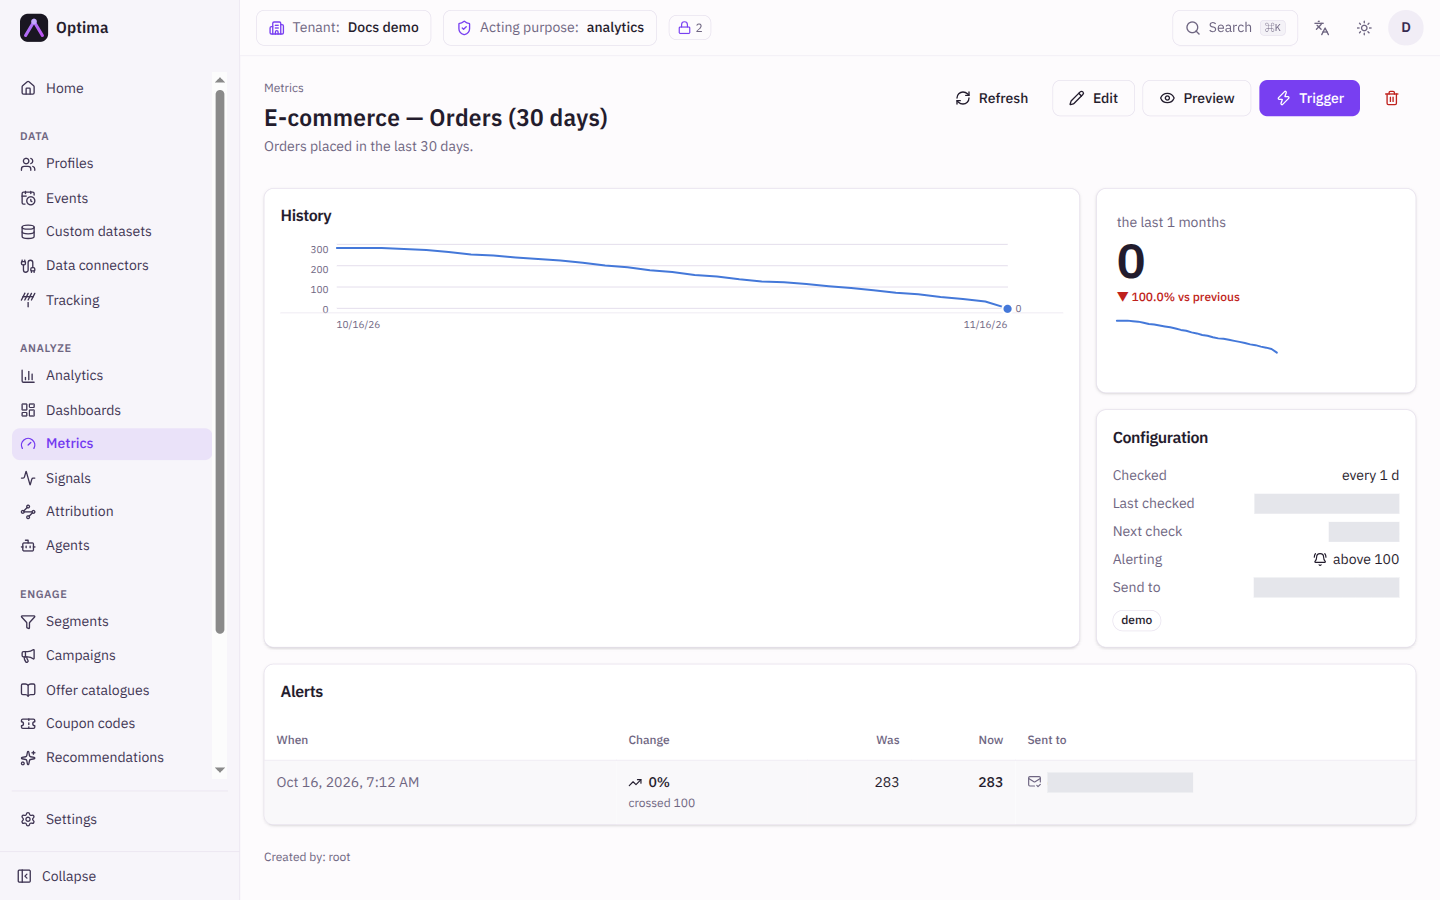
- In the metric's more actions menu select Trigger. It runs a full check now, exactly as the schedule would: it records the value and sends an alert if the rule qualifies. A message tells you whether an alert was sent.
- Open the metric by selecting its name. History charts every recorded value. With one value it says a line needs a second check.
- To see an alert fire, temporarily set Change of at least (%) to a small number such as
1, trigger, check your inbox, and set it back.
A new metric shows Not checked yet until its first check. Trigger records one at once.
Step 5: Change how the email reads (optional)
Alert emails use a notification template named metric_alert. You do not need a notification subscription for it; the people in Send to receive the email directly.
- Open Settings → Workspace → Notifications and the Templates tab. Edit
metric_alert, or select New template and choosemetric_alertas the Template name. - Write the Subject template and body with placeholders such as
{{.metric_name}},{{.previous_value}},{{.current_value}},{{.unit}}and{{.change_pct}}. - Select Preview to check, then save.
{{.metric_name}} is at {{.current_value}} {{.unit}} (was {{.previous_value}})See Notifications.
Check that it worked
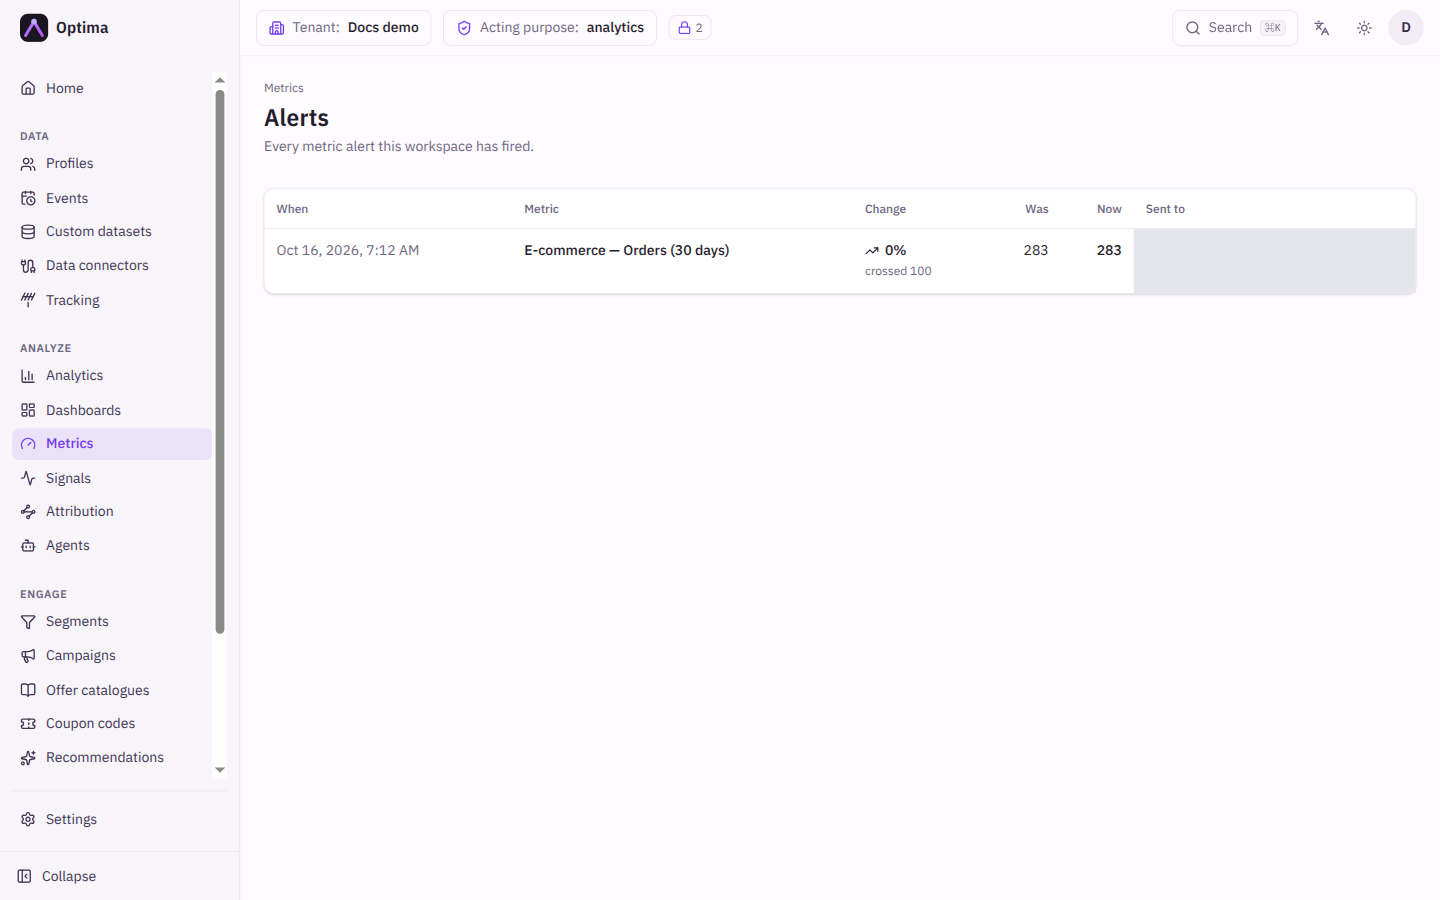
- Open Alerts at the top of the Metrics screen. The alert feed lists each alert with When, the metric, the Change, Was, Now and Sent to.
- Sent to names the people emailed. Not sent, with a reason, means no email went out. Open the metric and review Send to.
- The email arrives in the recipients' inboxes.
A fired alert is also the trigger of the anomaly explainer agent, which can look into why the metric moved.
Common problems
- I get no emails. Check that Email me when this changes is on, that you are listed under Send to, and that the rule can fire. A percentage rule ignores values below Ignore below. After an alert the metric stays quiet for its Then stay quiet for period.
- The metric keeps alerting. Raise Change of at least (%), or lengthen Then stay quiet for.
- The last check failed. The metric page says why. The value on screen is the last good one.
- The metric is paused. Check this metric on schedule is off.
- I cannot create or trigger a metric. That needs
analytics_editor. A metric can also be refused if it is built from data your privacy clearance does not cover.
Next steps
- Put several metrics on one screen with Dashboards.
- Alert on a plan limit with the metric rule It crosses a fixed value on profile count, and read Usage.
- Metrics describes every rule and the metric page.
Connect an AI assistant
Give an AI assistant such as Claude or ChatGPT safe, audited access to Optima with a dedicated API key and the connector address.
Get a weekly digest from an agent
Build an agent that emails you a summary of last week's campaigns every Friday, test it in dry run, then switch it live.